Recipes Docs
Abundances
Some convenience plotting types are available using MicrobiomePlots, Which also re-exports everything in StatsPlots
using Microbiome
using MicrobiomePlots
using Distributions

# add some high abundance bugs to be a bit more realistic
function spikein(spikes, y, x)
    m = rand(LogNormal(), y, x)
    for s in spikes
        m[s, :] = rand(LogNormal(3., 0.5), x)'
    end
    return m
end

# 100 species in 10 samples, with every 10th bug a bit more abundant
bugs = spikein(1:10:100, 100, 10)

abund = abundancetable(bugs,
    ["sample_$x" for x in 1:10],
    ["species_$x" for x in 1:100]);

relativeabundance!(abund)
abundanceplot(abund, xticks=(1:10, samplenames(abund)), xrotation=45)
GKS: String is too long in routine TEXT
GKS: String is too long in routine TEXT
GKS: String is too long in routine TEXT
GKS: String is too long in routine TEXT
GKS: String is too long in routine TEXT
GKS: String is too long in routine TEXT
GKS: String is too long in routine TEXT
GKS: String is too long in routine TEXT
GKS: String is too long in routine TEXT
GKS: String is too long in routine TEXT
GKS: String is too long in routine TEXT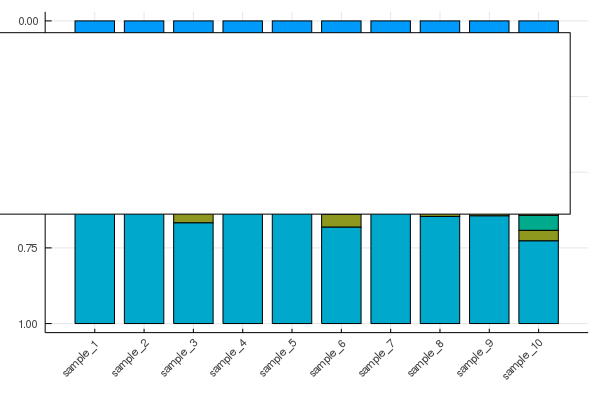
Metadata
Perhaps you have some metadata that you'd like to add as well:
labels = ["a","a","b","a","b","b","b","b","a","a"]

plot(
    abundanceplot(abund, xticks=(1:10, samplenames(abund)), xrotation=45),
    plot(annotationbar(labels)),
    layout=grid(2,1, heights=[0.9,0.1]))
GKS: String is too long in routine TEXT
GKS: String is too long in routine TEXT
GKS: String is too long in routine TEXT
GKS: String is too long in routine TEXT
GKS: String is too long in routine TEXT
GKS: String is too long in routine TEXT
GKS: String is too long in routine TEXT
GKS: String is too long in routine TEXT
GKS: String is too long in routine TEXT
GKS: String is too long in routine TEXT
GKS: String is too long in routine TEXT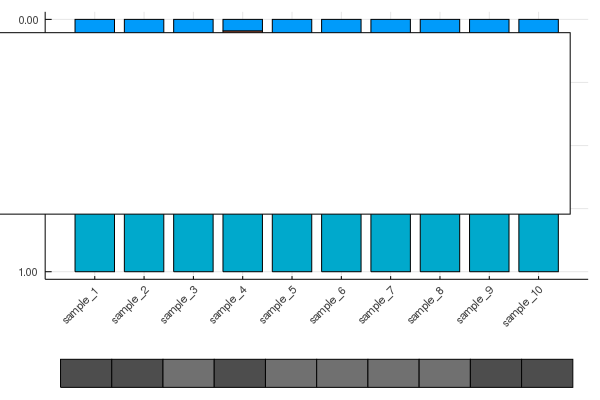
Distances
To plot this, use the MDS or PCA implementations from MultivariateStats and plotting functionality from StatsPlots.
using MultivariateStats
using Distances

# Note - once [SpatialEcology #36](https://github.com/EcoJulia/SpatialEcology.jl/pull/36)
# is released, one will be able to do `pairwise(BrayCurtis(), abund)` directly
dm = pairwise(BrayCurtis(), occurrences(abund))

mds = fit(MDS, dm, distances=true)

plot(mds)Optimal Leaf Ordering
I also wrote a plotting recipe for making treeplots for Hclust objects from the Clustering.jl package, and the recipe for plotting was moved into StatsPlots:
using Clustering
using Distances
using MicrobiomePlots
using Random

n = 40

mat = zeros(Int, n, n)
# create banded matrix
for i in 1:n
    last = minimum([i+Int(floor(n/5)), n])
    for j in i:last
        mat[i,j] = 1
    end
end

# randomize order
mat = mat[:, randperm(n)]
dm = pairwise(Euclidean(), mat, dims=2)

# normal ordering
hcl1 = hclust(dm, linkage=:average)
plot(
    plot(hcl1, xticks=false),
    heatmap(mat[:, hcl1.order], colorbar=false, xticks=(1:n, ["$i" for i in hcl1.order])),
    layout=grid(2,1, heights=[0.2,0.8])
)Compare to:
# optimal ordering
hcl2 = hclust(dm, linkage=:average, branchorder=:optimal)
plot(
    plot(hcl2, xticks=false),
    heatmap(mat[:, hcl2.order], colorbar=false, xticks=(1:n, ["$i" for i in hcl2.order])),
    layout=grid(2,1, heights=[0.2,0.8])
)MicrobiomePlots.AnnotationBar — TypeAnnotationBar(::Array{<:Color,1})Array of colors for plotting a grid. Use plot(::AnnotationBar; kwargs...)
MicrobiomePlots.annotationbar — Methodannotationbar(colors::AbstractArray{<:Color,1})
annotationbar(labels::AbstractArray{<:AbstractString,1})
annotationbar(labels::AbstractArray{<:AbstractString,1}, colormap::Dict{<:AbstractString,<:Color})
annotationbar(labels::AbstractArray{<:AbstractString,1}, colors::AbstractArray{<:Color,1})Create an AnnotationBar from a vector of colors or a vector of labels (Strings).
- A vector of
Colors will be used directly to create anAnnotationBar - For an array of
Strings, each unique value will be assigned a random color fromColors.color_names. - A vector of labels may be passed with a
Dictwith keys for eachlabelmapping to aColorvalue. - A vector of
labelsandcolorsmay be used.- If the lengths of these vectors are the same, the
colorswill be used to create an AnnotationBar - If the length of
labelsis longer than the length ofcolors, each unique label will be assigned to one of thecolors
- If the lengths of these vectors are the same, the