
A bit about FST
If you have spent any time being exposed to population genetics, you've likely encountered the term FST, our field's most beloved/maligned one-size-fits all coefficient. That description is a gross oversimplification, but the purpose of this post isn't to dig deep into the world of differentiation statistics, but instead shed light on the general concept and the logic behind its significance testing.
If you're like me, you've used and reported some kind of pairwise XST statistic in your work, where that value was generated using some fantastic software like adegenet or GenoDive, and you trusted that the methods were honest and appropriate (they are!). Part of the motivation behind PopGen.jl was to invest time into learning and understanding some of these methods I use, despite not coming from a mathematics or computer science background. Well, as I actually learn stuff and decode methods (no pun intended), I feel like it might be worthwhile to share some of my basic insights with others, in a way that I wish I could have been taught. So, this time it's FST. The purpose of this post is to cover the larger concepts without getting into the overwhelming math. Let's go!
What is FST?
To understand FST, we need to start with F, the inbreeding coefficient devised by brilliant-but-ethically-questionable Sewall Wright. The F coefficient was a mathematically simple way to understand the level of inbreeding in a group, originally described for cattle breeds (the 🐄 part isn't relevant, but it's a fun fact). There were three circumstantial versions of F, denoted by very straightforward subscripted letters: FIT, FIS, FST. The I stands for Individual, S for Subpopulation, T for Total. The combination of letters explains what relationship you are measuring: FIT was the comparison of F for an Individual vs the Total, FIS was the comparison of F for an Individual vs a Subpopulation.
Logically, FST would then mean you were looking at F for Subpopulations vs the Total, which is where population geneticists get all excited. The values range from 0 to 1, with 0 being panmixia (fully mixed) and 1 being complete isolation. Although it seems like it would be linear, it's not-- Wright considered 0.125 to be the cutoff between panmictic and divergent. If one was to calculate FST for one large group of individuals and get a value >0.125, this would suggest there is population subdivision happening (exciting!!).
Pairwise FST
Going one step further, you can narrow how you calculate FST to identify different trends. A "pairwise" FST is when you calculate FST for only a pair of populations at a time. With a pairwise FST, you are now testing if two populations are panmictic or divergent with each other. Depending on your study system and the questions you're trying to answer, this can be extremely valuable information.
From a genetic standpoint, it looks kinda like this:
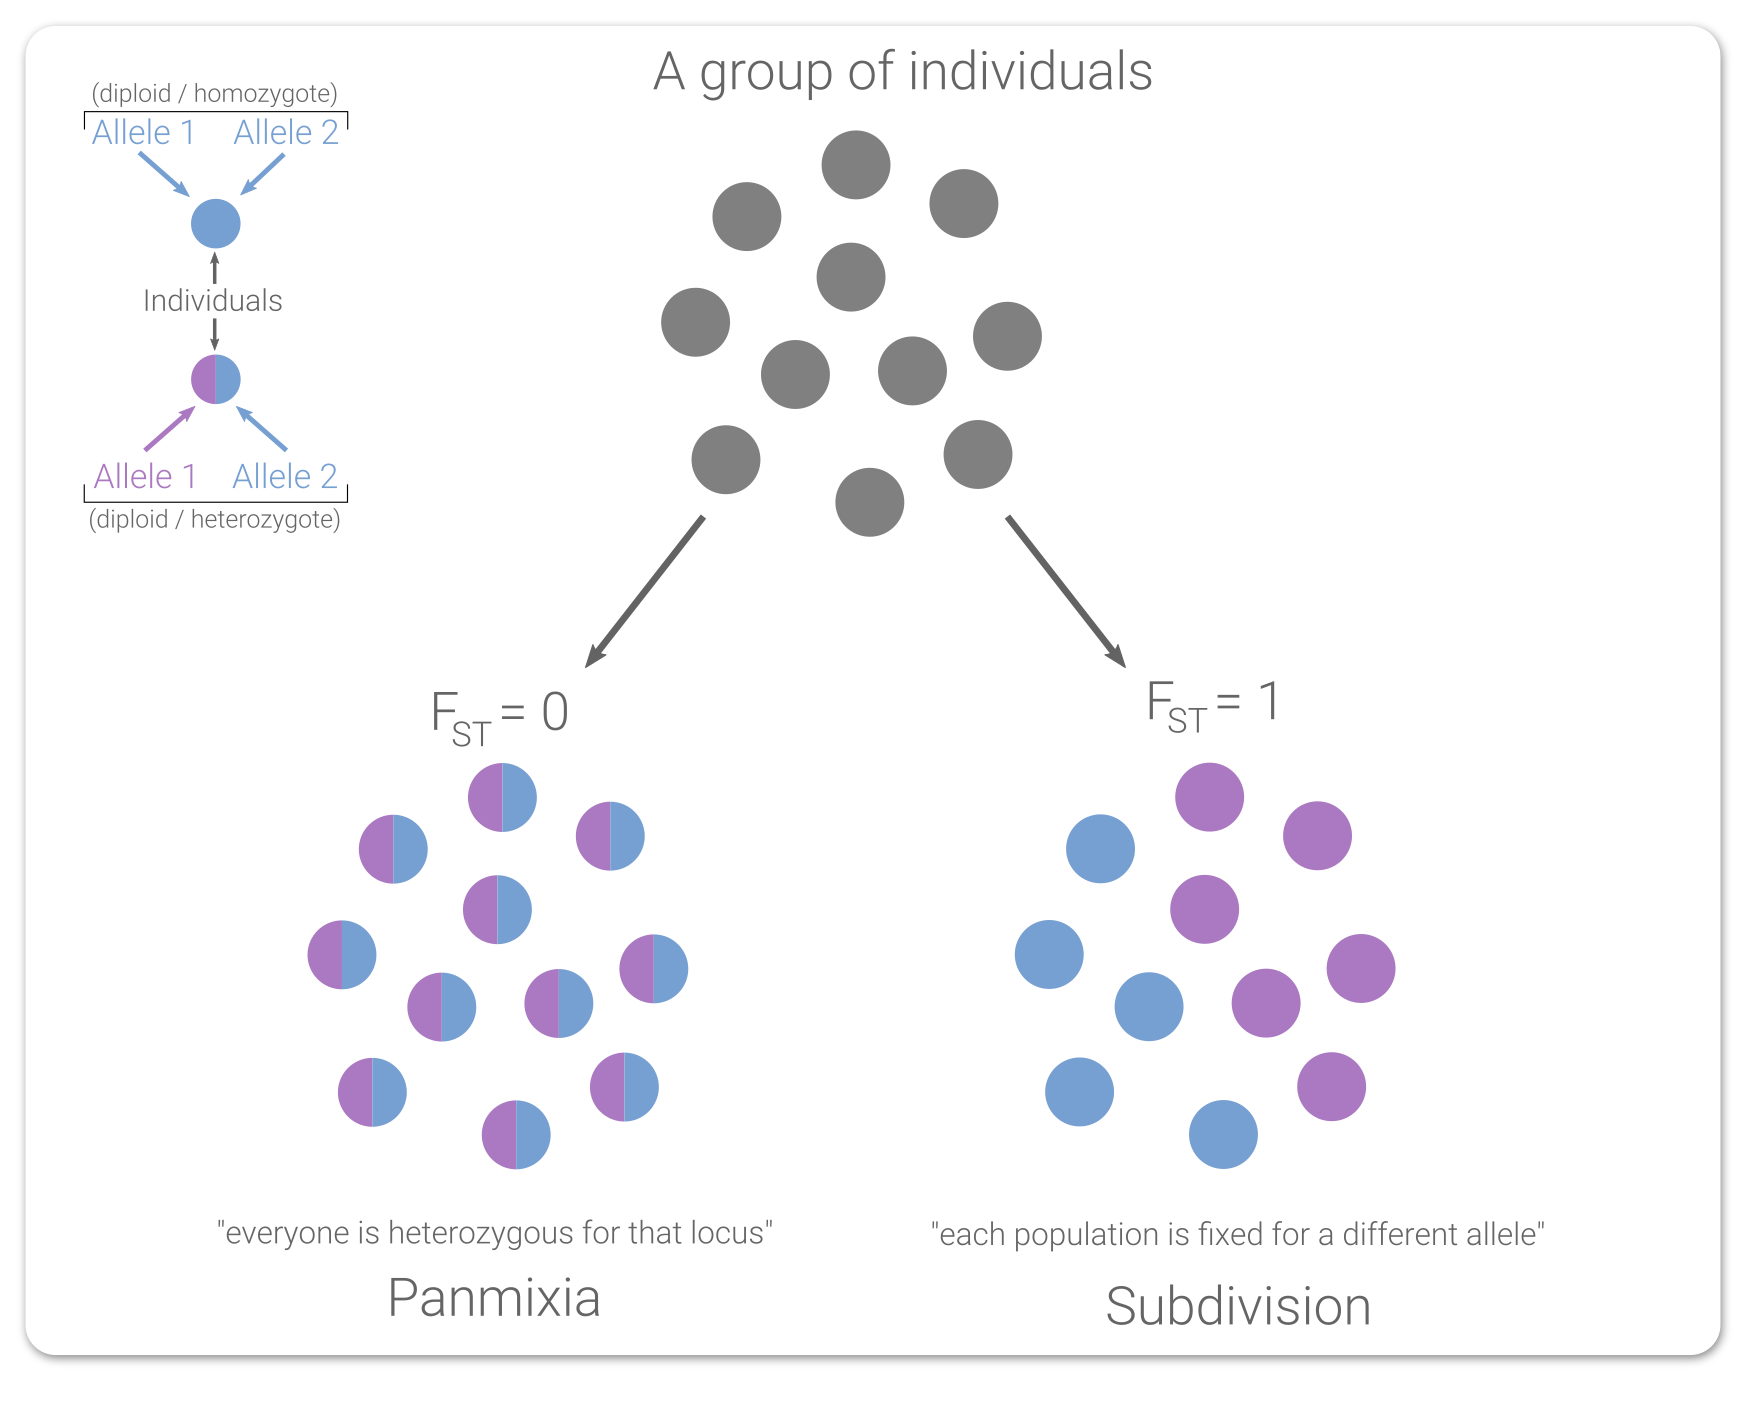
This is an over-simplified system (diploid, single locus, biallelic, ignoring Hardy-Weinberg stuff), but it demonstrates the point. When you are investigating two groups, if they are both completely heterozygous for the locus (for the same alleles), you would assume the groups are fully mixed (FST = 0). And that makes sense, right? Given the information required to calculate FST, it's a reasonable conclusion to say those alleles are constantly shared between the groups. And the opposite then should be true too: if both groups are completely fixed for different alleles (FST = 1), then they clearly aren't sharing alleles with each other.
Pitfalls
Like I alluded to in the opening paragraph, FST (and it's derivatives) aren't a golden rule. There are natural phenomena that FST cannot account for, which may lead to misleading results or incorrect interpretations of results. For one, there are Hardy-Weinberg assumptions, so the presence of kin, overlapping generations, etc. kinda messes things up. Another is consideration is that the genetic data we collect now is only a snapshot in time. If two populations are completely isolated from one another and have been for generations, but are long lived and slow to evolve, then FST may mislead you into believing they are panmictic (that happened in my shark study). These are just a few examples and there are more.
Significance testing
One way of being more rigorous with FST values is significance testing (you know, generating those p-values everyone loves so much). So the question is, how do we do that? One common (frequentist) solution is permutation testing. The rationale is this: we get some kind of observed FST with our samples arranged in their natural populations, so would that FST look the same if we shuffled the samples up? Honestly, that's the gist of it. We calculate our observed FST value, then we randomly shuffle the samples into two new populations and recalculate the pairwise FST for the new population pair. Then we just keep shuffling and recalculating FST a few thousands of times. After so many iterations, we compare how many times our observed (original) FST value was greater than the permuted FST values. This is known as a one-tailed test, since we're only interested in knowing if our observed FST is greater than randomness, meaning we're making the case that FST (and therefore divergence) is highest with our samples in this non-random population configuration.
Other means
The field of population genetics has expanded tremendously since the Fisher and Wright era, and there are now all sorts of interesting ways to identify population subdivision. Each method has its strengths and weaknesses, which is why it's good practice to try multiple things and find agreement between methods. At the time of this writing, PopGen.jl can calculate pairwise FST and perform significance testing using the Nei 1987, Weir & Cockerham 1984, and Hudson et al. 1992 methods. If you're interested in contributing to PopGen.jl, we'd love to have you!